In the previous section on parsing geometric meaning a definite integral, we received a number of formulas for calculating the area of a curvilinear trapezoid:
S (G) = ∫ a b f (x) d x for a continuous and non-negative function y = f (x) on the segment [ a ; b] ,
S (G) = - ∫ a b f (x) d x for a continuous and non-positive function y = f (x) on the segment [ a ; b] .
These formulas are applicable to solve relative simple tasks. In fact, we often have to work with more complex shapes. In this regard, we will devote this section to the analysis of algorithms for calculating the area of figures, which are limited by functions in an explicit form, i.e. like y = f(x) or x = g(y) .
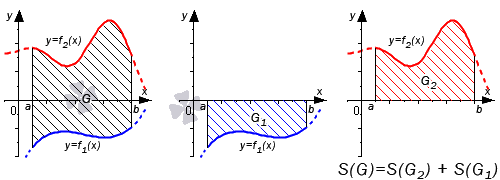
TheoremLet the functions y = f 1 (x) and y = f 2 (x) be defined and continuous on the segment [ a ; b ] , and f 1 (x) ≤ f 2 (x) for any value x from [ a ; b] . Then the formula for calculating the area of \u200b\u200bthe figure G, bounded by lines x = a , x = b , y = f 1 (x) and y = f 2 (x) will look like S (G) = ∫ a b f 2 (x) - f 1 (x) d x .
A similar formula will be applicable for the area of \u200b\u200bthe figure bounded by the lines y \u003d c, y \u003d d, x \u003d g 1 (y) and x \u003d g 2 (y): S (G) \u003d ∫ c d (g 2 (y) - g 1 (y) d y .
Proof
We will analyze three cases for which the formula will be valid.
In the first case, taking into account the additivity property of the area, the sum of the areas of the original figure G and the curvilinear trapezoid G 1 is equal to the area of the figure G 2 . It means that

Therefore, S (G) = S (G 2) - S (G 1) = ∫ a b f 2 (x) d x - ∫ a b f 1 (x) d x = ∫ a b (f 2 (x) - f 1 (x)) d x .
We can perform the last transition using the third property of the definite integral.
In the second case, the equality is true: S (G) = S (G 2) + S (G 1) = ∫ a b f 2 (x) d x + - ∫ a b f 1 (x) d x = ∫ a b (f 2 (x) - f 1 (x)) d x
The graphic illustration will look like:
If both functions are non-positive, we get: S (G) = S (G 2) - S (G 1) = - ∫ a b f 2 (x) d x - - ∫ a b f 1 (x) d x = ∫ a b (f 2 (x) - f 1 (x)) d x . The graphic illustration will look like:

Let's move on to the consideration of the general case when y = f 1 (x) and y = f 2 (x) intersect the axis O x .
We will denote the intersection points as x i , i = 1 , 2 , . . . , n - 1 . These points break the segment [ a ; b ] into n parts x i - 1 ; x i , i = 1 , 2 , . . . , n , where α = x 0< x 1 < x 2 < . . . < x n - 1 < x n = b . Фигуру G можно представить объединением фигур G i , i = 1 , 2 , . . . , n . Очевидно, что на своем интервале G i попадает под один из трех рассмотренных ранее случаев, поэтому их площади находятся как S (G i) = ∫ x i - 1 x i (f 2 (x) - f 1 (x)) d x , i = 1 , 2 , . . . , n
Hence,
S (G) = ∑ i = 1 n S (G i) = ∑ i = 1 n ∫ x i x i f 2 (x) - f 1 (x)) d x = = ∫ x 0 x n (f 2 (x) - f ( x)) d x = ∫ a b f 2 (x) - f 1 (x) d x
We can make the last transition using the fifth property of the definite integral.
Let us illustrate the general case on the graph.

The formula S (G) = ∫ a b f 2 (x) - f 1 (x) d x can be considered proven.
And now let's move on to the analysis of examples of calculating the area of \u200b\u200bfigures that are limited by the lines y \u003d f (x) and x \u003d g (y) .
Considering any of the examples, we will begin with the construction of a graph. The image will allow us to represent complex shapes as unions of more simple figures. If plotting graphs and shapes on them is difficult for you, you can study the section on basic elementary functions, geometric transformation of graphs of functions, as well as plotting during the study of a function.
Example 1
It is necessary to determine the area of \u200b\u200bthe figure, which is limited by the parabola y \u003d - x 2 + 6 x - 5 and straight lines y \u003d - 1 3 x - 1 2, x \u003d 1, x \u003d 4.
Solution
Let's plot the lines on the graph in the Cartesian coordinate system.

On the interval [ 1 ; 4] the graph of the parabola y = - x 2 + 6 x - 5 is located above the straight line y = - 1 3 x - 1 2 . In this regard, to obtain an answer, we use the formula obtained earlier, as well as the method for calculating a definite integral using the Newton-Leibniz formula:
S (G) = ∫ 1 4 - x 2 + 6 x - 5 - - 1 3 x - 1 2 d x = = ∫ 1 4 - x 2 + 19 3 x - 9 2 d x = - 1 3 x 3 + 19 6 x 2 - 9 2 x 1 4 = = - 1 3 4 3 + 19 6 4 2 - 9 2 4 - - 1 3 1 3 + 19 6 1 2 - 9 2 1 = = - 64 3 + 152 3 - 18 + 1 3 - 19 6 + 9 2 = 13
Answer: S (G) = 13
Let's look at a more complex example.
Example 2
It is necessary to calculate the area of the figure, which is limited by the lines y = x + 2 , y = x , x = 7 .
Solution
In this case, we have only one straight line parallel to the x-axis. This is x = 7 . This requires us to find the second integration limit ourselves.
Let's build a graph and put on it the lines given in the condition of the problem.

Having a graph in front of our eyes, we can easily determine that the lower limit of integration will be the abscissa of the intersection point of the graph with a straight line y \u003d x and a semi-parabola y \u003d x + 2. To find the abscissa, we use the equalities:
y = x + 2 O DZ: x ≥ - 2 x 2 = x + 2 2 x 2 - x - 2 = 0 D = (- 1) 2 - 4 1 (- 2) = 9 x 1 = 1 + 9 2 = 2 ∈ O D G x 2 = 1 - 9 2 = - 1 ∉ O D G
It turns out that the abscissa of the intersection point is x = 2.
We draw your attention to the fact that in general example in the drawing, the lines y = x + 2 , y = x intersect at the point (2 ; 2) , so such detailed calculations may seem redundant. We brought here detailed solution only because in more complex cases the solution may not be so obvious. This means that it is better to always calculate the coordinates of the intersection of lines analytically.
On the interval [ 2 ; 7 ] the graph of the function y = x is located above the graph of the function y = x + 2 . Apply the formula to calculate the area:
S (G) = ∫ 2 7 (x - x + 2) d x = x 2 2 - 2 3 (x + 2) 3 2 2 7 = = 7 2 2 - 2 3 (7 + 2) 3 2 - 2 2 2 - 2 3 2 + 2 3 2 = = 49 2 - 18 - 2 + 16 3 = 59 6
Answer: S (G) = 59 6
Example 3
It is necessary to calculate the area of \u200b\u200bthe figure, which is limited by the graphs of the functions y \u003d 1 x and y \u003d - x 2 + 4 x - 2.
Solution
Let's draw lines on the graph.

Let's define the limits of integration. To do this, we determine the coordinates of the points of intersection of the lines by equating the expressions 1 x and - x 2 + 4 x - 2 . Provided that x is not equal to zero, the equality 1 x \u003d - x 2 + 4 x - 2 becomes equivalent to the equation of the third degree - x 3 + 4 x 2 - 2 x - 1 \u003d 0 with integer coefficients. You can refresh the memory of the algorithm for solving such equations by referring to the section “Solution of cubic equations”.
The root of this equation is x = 1: - 1 3 + 4 1 2 - 2 1 - 1 = 0.
Dividing the expression - x 3 + 4 x 2 - 2 x - 1 by the binomial x - 1, we get: - x 3 + 4 x 2 - 2 x - 1 ⇔ - (x - 1) (x 2 - 3 x - 1) = 0
We can find the remaining roots from the equation x 2 - 3 x - 1 = 0:
x 2 - 3 x - 1 = 0 D = (- 3) 2 - 4 1 (- 1) = 13 x 1 = 3 + 13 2 ≈ 3 . 3; x 2 \u003d 3 - 13 2 ≈ - 0. 3
We have found an interval x ∈ 1; 3 + 13 2 , where G is enclosed above the blue line and below the red line. This helps us determine the area of the shape:
S (G) = ∫ 1 3 + 13 2 - x 2 + 4 x - 2 - 1 x d x = - x 3 3 + 2 x 2 - 2 x - ln x 1 3 + 13 2 = = - 3 + 13 2 3 3 + 2 3 + 13 2 2 - 2 3 + 13 2 - ln 3 + 13 2 - - - 1 3 3 + 2 1 2 - 2 1 - ln 1 = 7 + 13 3 - ln 3 + 13 2
Answer: S (G) \u003d 7 + 13 3 - ln 3 + 13 2
Example 4
It is necessary to calculate the area of the figure, which is limited by the curves y \u003d x 3, y \u003d - log 2 x + 1 and the abscissa axis.
Solution
Let's put all the lines on the graph. We can get the graph of the function y = - log 2 x + 1 from the graph y = log 2 x if we place it symmetrically about the x-axis and move it up one unit. The equation of the x-axis y \u003d 0.

Let's denote the points of intersection of the lines.
As can be seen from the figure, the graphs of the functions y \u003d x 3 and y \u003d 0 intersect at the point (0; 0) . This is because x \u003d 0 is the only real root of the equation x 3 \u003d 0.
x = 2 is the only root of the equation - log 2 x + 1 = 0 , so the graphs of the functions y = - log 2 x + 1 and y = 0 intersect at the point (2 ; 0) .
x = 1 is the only root of the equation x 3 = - log 2 x + 1 . In this regard, the graphs of the functions y \u003d x 3 and y \u003d - log 2 x + 1 intersect at the point (1; 1) . The last statement may not be obvious, but the equation x 3 \u003d - log 2 x + 1 cannot have more than one root, since the function y \u003d x 3 is strictly increasing, and the function y \u003d - log 2 x + 1 is strictly decreasing.
The next step involves several options.
Option number 1
We can represent the figure G as the sum of two curvilinear trapezoids located above the abscissa axis, the first of which is located below middle line on the segment x ∈ 0 ; 1 , and the second one is below the red line on the segment x ∈ 1 ; 2. This means that the area will be equal to S (G) = ∫ 0 1 x 3 d x + ∫ 1 2 (- log 2 x + 1) d x .
Option number 2
The figure G can be represented as the difference of two figures, the first of which is located above the x-axis and below the blue line on the segment x ∈ 0; 2 , and the second one is between the red and blue lines on the segment x ∈ 1 ; 2. This allows us to find the area like this:
S (G) = ∫ 0 2 x 3 d x - ∫ 1 2 x 3 - (- log 2 x + 1) d x
In this case, to find the area, you will have to use a formula of the form S (G) \u003d ∫ c d (g 2 (y) - g 1 (y)) d y. In fact, the lines that bound the shape can be represented as functions of the y argument.
Let's solve the equations y = x 3 and - log 2 x + 1 with respect to x:
y = x 3 ⇒ x = y 3 y = - log 2 x + 1 ⇒ log 2 x = 1 - y ⇒ x = 2 1 - y
We get the required area:
S (G) = ∫ 0 1 (2 1 - y - y 3) d y = - 2 1 - y ln 2 - y 4 4 0 1 = = - 2 1 - 1 ln 2 - 1 4 4 - - 2 1 - 0 ln 2 - 0 4 4 = - 1 ln 2 - 1 4 + 2 ln 2 = 1 ln 2 - 1 4
Answer: S (G) = 1 ln 2 - 1 4
Example 5
It is necessary to calculate the area of the figure, which is limited by the lines y \u003d x, y \u003d 2 3 x - 3, y \u003d - 1 2 x + 4.
Solution
Draw a line on the chart with a red line, given by the function y = x . Draw the line y = - 1 2 x + 4 in blue, and mark the line y = 2 3 x - 3 in black.

Note the intersection points.
Find the intersection points of the graphs of functions y = x and y = - 1 2 x + 4:
x = - 1 2 x + 4 O DZ: x ≥ 0 x = - 1 2 x + 4 2 ⇒ x = 1 4 x 2 - 4 x + 16 ⇔ x 2 - 20 x + 64 = 0 D = (- 20) 2 - 4 1 64 \u003d 144 x 1 \u003d 20 + 144 2 \u003d 16; x 2 = 20 - 144 2 = 4 i is the solution x 2 = 4 = 2 , - 1 2 x 2 + 4 = - 1 2 4 + 4 = 2 ⇒ x 2 = 4 is the solution to the equation ⇒ (4 ; 2) point of intersection i y = x and y = - 1 2 x + 4
Find the intersection point of the graphs of functions y = x and y = 2 3 x - 3:
x = 2 3 x - 3 O DZ: x ≥ 0 x = 2 3 x - 3 2 ⇔ x = 4 9 x 2 - 4 x + 9 ⇔ 4 x 2 - 45 x + 81 = 0 D = (- 45 ) 2 - 4 4 81 = 729 x 1 = 45 + 729 8 = 9, x 2 45 - 729 8 = 9 4 Check: x 1 = 9 = 3, 2 3 x 1 - 3 \u003d 2 3 9 - 3 \u003d 3 ⇒ x 1 \u003d 9 is the solution to the equation ⇒ (9; 3) point and intersection y = x and y = 2 3 x - 3 x 2 = 9 4 = 3 2 , 2 3 x 1 - 3 = 2 3 9 4 - 3 = - 3 2 ⇒ x 2 = 9 4 is not a solution to the equation
Find the point of intersection of the lines y = - 1 2 x + 4 and y = 2 3 x - 3:
1 2 x + 4 = 2 3 x - 3 ⇔ - 3 x + 24 = 4 x - 18 ⇔ 7 x = 42 ⇔ x = 6 - 1 2 6 + 4 = 2 3 6 - 3 = 1 ⇒ (6 ; 1) point of intersection y = - 1 2 x + 4 and y = 2 3 x - 3
Method number 1
We represent the area of the desired figure as the sum of the areas of individual figures.

Then the area of the figure is:
S (G) = ∫ 4 6 x - - 1 2 x + 4 d x + ∫ 6 9 x - 2 3 x - 3 d x = = 2 3 x 3 2 + x 2 4 - 4 x 4 6 + 2 3 x 3 2 - x 2 3 + 3 x 6 9 = = 2 3 6 3 2 + 6 2 4 - 4 6 - 2 3 4 3 2 + 4 2 4 - 4 4 + + 2 3 9 3 2 - 9 2 3 + 3 9 - 2 3 6 3 2 - 6 2 3 + 3 6 = = - 25 3 + 4 6 + - 4 6 + 12 = 11 3
Method number 2
The area of the original figure can be represented as the sum of the other two figures.

Then we solve the line equation for x, and only after that we apply the formula for calculating the area of \u200b\u200bthe figure.
y = x ⇒ x = y 2 red line y = 2 3 x - 3 ⇒ x = 3 2 y + 9 2 black line y = - 1 2 x + 4 ⇒ x = - 2 y + 8 s i n i i l i n i i
So the area is:
S (G) = ∫ 1 2 3 2 y + 9 2 - - 2 y + 8 d y + ∫ 2 3 3 2 y + 9 2 - y 2 d y = = ∫ 1 2 7 2 y - 7 2 d y + ∫ 2 3 3 2 y + 9 2 - y 2 d y = = 7 4 y 2 - 7 4 y 1 2 + - y 3 3 + 3 y 2 4 + 9 2 y 2 3 = 7 4 2 2 - 7 4 2 - 7 4 1 2 - 7 4 1 + + - 3 3 3 + 3 3 2 4 + 9 2 3 - - 2 3 3 + 3 2 2 4 + 9 2 2 = = 7 4 + 23 12 = 11 3
As you can see, the values match.
Answer: S (G) = 11 3
Results
To find the area of a figure that is bounded by given lines, we need to draw lines on a plane, find their intersection points, and apply the formula for finding the area. In this section, we have reviewed the most common options for tasks.
If you notice a mistake in the text, please highlight it and press Ctrl+Enter
We now turn to the consideration of applications of the integral calculus. In this lesson, we will analyze a typical and most common task. area calculations flat figure using a definite integral. Finally, all those who seek meaning in higher mathematics - may they find it. You never know. In real life, you will have to approximate a summer cottage with elementary functions and find its area using a certain integral.
To successfully master the material, you must:
1) Understand the indefinite integral at least at an intermediate level. Thus, dummies should first read the lesson Not.
2) Be able to apply the Newton-Leibniz formula and calculate the definite integral. Forge warm friendly relations with definite integrals can be found on the page Definite integral. Solution examples. The task "calculate the area using a definite integral" always involves the construction of a drawing, therefore, your knowledge and drawing skills will also be an urgent issue. At a minimum, one must be able to build a straight line, a parabola and a hyperbola.
Let's start with a curvilinear trapezoid. A curvilinear trapezoid is a flat figure bounded by the graph of some function y = f(x), axis OX and lines x = a; x = b.
The area of a curvilinear trapezoid is numerically equal to a certain integral
Any definite integral (that exists) has a very good geometric meaning. At the lesson Definite integral. Solution examples we said that a definite integral is a number. And now it's time to state another useful fact. From the point of view of geometry, the definite integral is the AREA. That is, the definite integral (if it exists) geometrically corresponds to the area of some figure. Consider the definite integral
Integrand
defines a curve on the plane (it can be drawn if desired), and the definite integral itself is numerically equal to the area of the corresponding curvilinear trapezoid.
Example 1
, , , .
This is a typical assignment. The most important point of the decision is the construction of a drawing. Moreover, the drawing must be built RIGHT.
When building a blueprint, I recommend the following order: at first it is better to construct all lines (if any) and only Then- parabolas, hyperbolas, graphs of other functions. The technique of pointwise construction can be found in reference material Graphs and Properties elementary functions . There you can also find material that is very useful in relation to our lesson - how to quickly build a parabola.
In this problem, the solution might look like this.
Let's make a drawing (note that the equation y= 0 specifies the axis OX):

We will not hatch the curvilinear trapezoid, it is obvious what area we are talking about here. The solution continues like this:
On the interval [-2; 1] function graph y = x 2 + 2 located over axisOX, That's why:
Answer: .
Who has difficulty calculating the definite integral and applying the Newton-Leibniz formula
 ,
,
refer to the lecture Definite integral. Solution examples. After the task is completed, it is always useful to look at the drawing and figure out if the answer is real. In this case, “by eye” we count the number of cells in the drawing - well, about 9 will be typed, it seems to be true. It is quite clear that if we had, say, the answer: 20 square units, then, obviously, a mistake was made somewhere - 20 cells clearly do not fit into the figure in question, at most a dozen. If the answer turned out to be negative, then the task was also solved incorrectly.
Example 2
Calculate the area of a figure bounded by lines xy = 4, x = 2, x= 4 and axis OX.
This is an example for independent decision. Complete Solution and the answer at the end of the lesson.
What to do if the curvilinear trapezoid is located under axleOX?
Example 3
Calculate the area of a figure bounded by lines y = e-x, x= 1 and coordinate axes.
Solution: Let's make a drawing:

If a curvilinear trapezoid completely under the axle OX , then its area can be found by the formula:
In this case:
 .
.
Attention! The two types of tasks should not be confused:
1) If you are asked to solve just a definite integral without any geometric meaning, then it can be negative.
2) If you are asked to find the area of a figure using a definite integral, then the area is always positive! That is why the minus appears in the formula just considered.
In practice, most often the figure is located in both the upper and lower half-planes, and therefore, from the simplest school problems, we move on to more meaningful examples.
Example 4
Find the area of a plane figure bounded by lines y = 2x – x 2 , y = -x.
Solution: First you need to make a drawing. When constructing a drawing in area problems, we are most interested in the intersection points of lines. Find the intersection points of the parabola y = 2x – x 2 and straight y = -x. This can be done in two ways. The first way is analytical. We solve the equation:
So the lower limit of integration a= 0, upper limit of integration b= 3. It is often more profitable and faster to construct lines point by point, while the limits of integration are found out as if “by themselves”. Nevertheless, the analytical method of finding the limits still sometimes has to be used if, for example, the graph is large enough, or the threaded construction did not reveal the limits of integration (they can be fractional or irrational). We return to our task: it is more rational to first construct a straight line and only then a parabola. Let's make a drawing:

We repeat that in pointwise construction, the limits of integration are most often found out “automatically”.
And now the working formula:
If on the interval [ a; b] some continuous function f(x) greater than or equal some continuous function g(x), then the area of the corresponding figure can be found by the formula:

Here it is no longer necessary to think where the figure is located - above the axis or below the axis, but it matters which chart is ABOVE(relative to another graph), and which one is BELOW.
In the example under consideration, it is obvious that on the segment the parabola is located above the straight line, and therefore from 2 x – x 2 must be subtracted - x.
The completion of the solution might look like this:
The desired figure is limited by a parabola y = 2x – x 2 top and straight y = -x from below.
On segment 2 x – x 2 ≥ -x. According to the corresponding formula:
Answer: .
In fact, the school formula for the area of a curvilinear trapezoid in the lower half-plane (see example No. 3) is a special case of the formula
 .
.
Since the axis OX is given by the equation y= 0, and the graph of the function g(x) is located below the axis OX, That
 .
.
And now a couple of examples for an independent decision
Example 5
Example 6
Find the area of a figure bounded by lines
In the course of solving problems for calculating the area using a certain integral, a funny incident sometimes happens. The drawing was made correctly, the calculations were correct, but, due to inattention, ... found the area of the wrong figure.
Example 7
Let's draw first:

The figure whose area we need to find is shaded in blue.(carefully look at the condition - how the figure is limited!). But in practice, due to inattention, they often decide that they need to find the area of \u200b\u200bthe figure that is shaded in green!
This example is also useful in that in it the area of \u200b\u200bthe figure is calculated using two definite integrals. Really:
1) On the segment [-1; 1] above axle OX the graph is straight y = x+1;
2) On the segment above the axis OX the graph of the hyperbola is located y = (2/x).
It is quite obvious that the areas can (and should) be added, therefore:

Answer:
Example 8
Calculate the area of a figure bounded by lines
Let's present the equations in the "school" form
and do the line drawing:

It can be seen from the drawing that our upper limit is “good”: b = 1.
But what is the lower limit? It is clear that this is not an integer, but what?
May be, a=(-1/3)? But where is the guarantee that the drawing is made with perfect accuracy, it may well turn out that a=(-1/4). What if we didn't get the graph right at all?
In such cases, one has to spend additional time and refine the limits of integration analytically.
Find the intersection points of the graphs
To do this, we solve the equation:

 .
.
Hence, a=(-1/3).
The further solution is trivial. The main thing is not to get confused in substitutions and signs. The calculations here are not the easiest. On the segment
, ![]() ,
,
according to the corresponding formula:

Answer: ![]()
In conclusion of the lesson, we will consider two tasks more difficult.
Example 9
Calculate the area of a figure bounded by lines
Solution: Draw this figure in the drawing.

To draw a drawing point by point, you need to know the appearance of the sinusoid. In general, it is useful to know the graphs of all elementary functions, as well as some values of the sine. They can be found in the table of values trigonometric functions . In some cases (for example, in this case), it is allowed to construct a schematic drawing, on which graphs and integration limits must be displayed in principle correctly.
There are no problems with the integration limits here, they follow directly from the condition:
- "x" changes from zero to "pi". We make a further decision:
On the segment, the graph of the function y= sin 3 x located above the axis OX, That's why:
(1) You can see how sines and cosines are integrated in odd powers in the lesson Integrals of trigonometric functions. We pinch off one sine.
(2) We use the basic trigonometric identity in the form
![]()
(3) Let us change the variable t= cos x, then: located above the axis , so:
 .
.
 .
.
Note: note how the integral of the tangent in the cube is taken, here the consequence of the basic trigonometric identity is used
![]() .
.
A)
Solution.
The first and most important moment of the decision is the construction of a drawing.
Let's make a drawing:
The equation y=0 sets the x-axis;
- x=-2 And x=1 - straight, parallel to the axis OU;
- y \u003d x 2 +2 - a parabola whose branches are directed upwards, with a vertex at the point (0;2).
Comment. To construct a parabola, it is enough to find the points of its intersection with the coordinate axes, i.e. putting x=0 find the intersection with the axis OU and deciding the appropriate quadratic equation, find the intersection with the axis Oh .
The vertex of a parabola can be found using the formulas:
You can draw lines and point by point.
On the interval [-2;1] the graph of the function y=x 2 +2 located over axis Ox , That's why:
Answer: S \u003d 9 square units
After the task is completed, it is always useful to look at the drawing and figure out if the answer is real. In this case, "by eye" we count the number of cells in the drawing - well, about 9 will be typed, it seems to be true. It is quite clear that if we had, say, the answer: 20 square units, then, obviously, a mistake was made somewhere - 20 cells clearly do not fit into the figure in question, at most a dozen. If the answer turned out to be negative, then the task was also solved incorrectly.
What to do if the curvilinear trapezoid is located under axle Oh?
b) Calculate the area of a figure bounded by lines y=-e x , x=1 and coordinate axes.
Solution.
Let's make a drawing.
If a curvilinear trapezoid completely under the axle Oh , then its area can be found by the formula:
Answer: S=(e-1) sq. unit" 1.72 sq. unit
Attention! Don't confuse the two types of tasks:
1) If you are asked to solve just a definite integral without any geometric meaning, then it can be negative.
2) If you are asked to find the area of a figure using a definite integral, then the area is always positive! That is why the minus appears in the formula just considered.
In practice, most often the figure is located in both the upper and lower half-planes.
With) Find the area of a plane figure bounded by lines y \u003d 2x-x 2, y \u003d -x.
Solution.
First you need to make a drawing. Generally speaking, when constructing a drawing in area problems, we are most interested in the intersection points of lines. Let's find the points of intersection of the parabola and the line. This can be done in two ways. The first way is analytical.
We solve the equation:
So the lower limit of integration a=0 , the upper limit of integration b=3 .
|
We build the given lines: 1. Parabola - vertex at the point (1;1); axis intersection Oh - points(0;0) and (0;2). 2. Straight line - the bisector of the 2nd and 4th coordinate angles. And now Attention! If on the segment [ a;b] some continuous function f(x) greater than or equal to some continuous function g(x), then the area of the corresponding figure can be found by the formula: . And it does not matter where the figure is located - above the axis or below the axis, but it is important which chart is HIGHER (relative to another chart), and which one is BELOW. In the example under consideration, it is obvious that on the segment the parabola is located above the straight line, and therefore it is necessary to subtract from |
It is possible to construct lines point by point, while the limits of integration are found out as if "by themselves". Nevertheless, the analytical method of finding the limits still sometimes has to be used if, for example, the graph is large enough, or the threaded construction did not reveal the limits of integration (they can be fractional or irrational).
The desired figure is limited by a parabola from above and a straight line from below.
On the segment , according to the corresponding formula:
Answer: S \u003d 4.5 sq. units
We figured out how to find the area of a curvilinear trapezoid G. Here are the resulting formulas:
for a continuous and non-negative function y=f(x) on the segment ,  for a continuous and non-positive function y=f(x) on the segment .
However, when solving problems of finding the area, one often has to deal with more complex figures.
In this article, we will talk about calculating the area of figures whose boundaries are explicitly specified by functions, that is, as y=f(x) or x=g(y) , and analyze in detail the solution of typical examples.
Page navigation.
Formula for calculating the area of a figure bounded by lines y=f(x) or x=g(y) .
Theorem.
Let the functions and be defined and continuous on the segment , and for any value x from . Then area of figure G, bounded by lines x=a , x=b , and is calculated by the formula  .
.
A similar formula is valid for the area of \u200b\u200bthe figure bounded by the lines y \u003d c, y \u003d d, and:  .
.
Proof.
Let us show the validity of the formula for three cases: 
In the first case, when both functions are non-negative, due to the additivity property of the area, the sum of the area of the original figure G and the curvilinear trapezoid is equal to the area of the figure. Hence, 
That's why, . The last transition is possible due to the third property of the definite integral.
Similarly, in the second case, the equality is true. Here is a graphic illustration: 
In the third case, when both functions are nonpositive, we have . Let's illustrate this: 
Now we can move on to the general case when the functions and cross the Ox axis.
Let's denote the intersection points. These points divide the segment into n parts , where . The figure G can be represented by the union of the figures ![]() . It is obvious that on its interval falls under one of the three cases considered earlier, therefore their areas are found as
. It is obvious that on its interval falls under one of the three cases considered earlier, therefore their areas are found as 
Hence, 
The last transition is valid due to the fifth property of the definite integral.
Graphic illustration of the general case.
Thus the formula proven.
It's time to move on to solving examples for finding the area of figures bounded by the lines y=f(x) and x=g(y) .
Examples of calculating the area of a figure bounded by lines y=f(x) or x=g(y) .
We will begin the solution of each problem by constructing a figure on a plane. This will allow us to represent a complex figure as a union of simpler figures. In case of difficulties with the construction, refer to the articles:; And .
Example.
Calculate the area of a figure bounded by a parabola ![]() and straight lines , x=1 , x=4 .
and straight lines , x=1 , x=4 .
Solution.
Let's build these lines on the plane. 
Everywhere on the segment, the graph of a parabola ![]() above straight. Therefore, we apply the previously obtained formula for the area and calculate the definite integral using the Newton-Leibniz formula:
above straight. Therefore, we apply the previously obtained formula for the area and calculate the definite integral using the Newton-Leibniz formula: 
Let's complicate the example a bit.
Example.
Calculate the area of the figure bounded by lines.
Solution.
How is this different from previous examples? Previously, we always had two straight lines parallel to the x-axis, and now only one x=7 . The question immediately arises: where to take the second limit of integration? Let's take a look at the drawing for this. 
It became clear that the lower limit of integration when finding the area of \u200b\u200bthe figure is the abscissa of the point of intersection of the graph of the straight line y \u003d x and the semi-parabola. We find this abscissa from the equality: 
Therefore, the abscissa of the intersection point is x=2 .
Note.
In our example and in the drawing, it can be seen that the lines and y=x intersect at the point (2;2) and the previous calculations seem redundant. But in other cases, things may not be so obvious. Therefore, we recommend that you always analytically calculate the abscissas and ordinates of the points of intersection of lines.
Obviously, the graph of the function y=x is located above the graph of the function on the interval . We apply the formula to calculate the area: 
Let's complicate the task even more.
Example.
Calculate the area of the figure bounded by the graphs of functions and ![]() .
.
Solution.
Let's build a graph inverse proportionality and parabolas ![]() .
.

Before applying the formula for finding the area of a figure, we need to decide on the limits of integration. To do this, we find the abscissas of the intersection points of the lines by equating the expressions and .
For values of x other than zero, the equality ![]() equivalent to third degree equation
equivalent to third degree equation ![]() with integer coefficients. You can refer to the section to recall the algorithm for solving it.
with integer coefficients. You can refer to the section to recall the algorithm for solving it.
It is easy to check that x=1 is the root of this equation: .
Dividing the expression ![]() to the binomial x-1 , we have:
to the binomial x-1 , we have:
Thus, the remaining roots are found from the equation ![]() :
:
Now from the drawing it became clear that the figure G is enclosed above the blue and below the red line in the interval  . Thus, the required area will be equal to
Let's look at another typical example.
Example.
Calculate the area of a figure bounded by curves ![]() and the abscissa axis.
and the abscissa axis.
Solution.
Let's make a drawing.
This is an ordinary power function with an exponent of one third, the plot of the function ![]() can be obtained from the graph by displaying it symmetrically about the x-axis and lifting it up by one.
can be obtained from the graph by displaying it symmetrically about the x-axis and lifting it up by one. 
Find the intersection points of all lines.
The x-axis has the equation y=0 .
The graphs of the functions and y=0 intersect at the point (0;0) since x=0 is the only real root of the equation.
Function Graphs ![]() and y=0 intersect at (2;0) , since x=2 is the only root of the equation
and y=0 intersect at (2;0) , since x=2 is the only root of the equation ![]() .
.
Function graphs and ![]() intersect at the point (1;1) since x=1 is the only root of the equation
intersect at the point (1;1) since x=1 is the only root of the equation ![]() . This statement is not entirely obvious, but is a strictly increasing function, and
. This statement is not entirely obvious, but is a strictly increasing function, and ![]() - strictly decreasing, therefore, the equation
- strictly decreasing, therefore, the equation ![]() has at most one root.
has at most one root.
The only remark: in this case, to find the area, you will have to use a formula of the form  . That is, the bounding lines must be represented as functions of the argument y , but with a black line .
Let's define the points of intersection of the lines.
Let's start with graphs of functions and : 
Let's find the point of intersection of graphs of functions and : 
It remains to find the point of intersection of the lines and : 

As you can see, the values match.
Summarize.
We have analyzed all the most common cases of finding the area of a figure bounded by explicitly given lines. To do this, you need to be able to build lines on a plane, find the points of intersection of lines and apply the formula to find the area, which implies the ability to calculate certain integrals.
In this lesson we will learn how to calculate areas of flat figures, which are called curvilinear trapezoids .
Examples of such figures are in the figure below.
On the one hand, finding the area of a flat figure using a definite integral is extremely simple. We are talking about the area of \u200b\u200bthe figure, which is limited from above by a certain curve, from below - by the abscissa axis ( Ox), and on the left and right are some straight lines. The simplicity is that definite integral the function to which the curve is given is the area of such a figure(curvilinear trapezoid).
To calculate the area of a figure, we need:
- Definite integral of the function defining the curve , which limits the curvilinear trapezoid from above. And here comes the first significant nuance: a curvilinear trapezoid can be limited by a curve not only from above, but also from below . How to act in this case? Simple but important to remember: the integral in this case is taken with a minus sign .
- Limits of integration a And b, which we find from the equations of lines that bound the figure on the left and right: x = a , x = b, Where a And b- numbers.
Separately, some more nuances.
The curve that limits the curvilinear trapezoid from above (or below) must be graph of a continuous and non-negative function y = f(x) .
X values must belong to the segment [a, b] . That is, such, for example, lines as a section of a mushroom are not taken into account, in which the leg fits perfectly into this segment, and the hat is much wider.
Side segments can degenerate into points . If you saw such a figure in the drawing, this should not confuse you, since this point always has its own value on the x-axis. So everything is in order with the limits of integration.
Now you can move on to formulas and calculations. So the area s curvilinear trapezoid can be calculated by the formula
If f(x) ≤ 0 (the graph of the function is located below the axis Ox), That area of a curved trapezoid can be calculated by the formula
There are also cases when both the upper and lower boundaries of the figure are functions, respectively y = f(x) And y = φ (x) , then the area of such a figure is calculated by the formula
![]() . (3)
. (3)
We solve problems together
Let's start with cases where the area of a figure can be calculated using formula (1).
Example 1Ox) and direct x = 1 , x = 3 .

Solution. Because y = 1/x> 0 on the segment , then the area of the curvilinear trapezoid is found by the formula (1):
 .
.
Example 2 Find the area of the figure bounded by the graph of the function , straight line x= 1 and the x-axis ( Ox ).

Solution. The result of applying formula (1):
![]()
If then s= 1/2; if then s= 1/3 , etc.
Example 3 Find the area of \u200b\u200bthe figure bounded by the graph of the function, the x-axis ( Ox) and direct x = 4 .

Solution. The figure corresponding to the condition of the problem is a curvilinear trapezoid, in which the left segment has degenerated into a point. The integration limits are 0 and 4. Since, according to formula (1), we find the area of the curvilinear trapezoid:
 .
.
Example 4 Find the area of the figure bounded by the lines , , and located in the 1st quarter.

Solution. To use formula (1), we represent the area of the figure given by the conditions of the example as the sum of the areas of a triangle OAB and curvilinear trapezoid ABC. When calculating the area of a triangle OAB the limits of integration are the abscissas of the points O And A, and for the figure ABC- abscissas of points A And C (A is the point of intersection of the line OA and parabolas, and C- point of intersection of the parabola with the axis Ox). Solving jointly (as a system) the equations of a straight line and a parabola, we obtain (the abscissa of the point A) and (the abscissa of another point of intersection of the line and the parabola, which is not needed for the solution). Similarly, we obtain , (abscissas of points C And D). Now we have everything to find the area of the figure. We find:

Example 5 Find the area of a curvilinear trapezoid ACDB, if the equation of the curve CD and abscissa A And B respectively 1 and 2.

Solution. We express this equation of the curve through Y: The area of the curvilinear trapezoid is found by the formula (1):
 .
.
Let's move on to cases where the area of a figure can be calculated using formula (2).
Example 6 Find the area of the figure bounded by the parabola and the x-axis ( Ox ).

Solution. This figure located below the x-axis. Therefore, to calculate its area, we use formula (2). The limits of integration are the abscissas and points of intersection of the parabola with the axis Ox. Hence,

Example 7 Find the area between the x-axis ( Ox) and two neighboring sine waves.

Solution. The area of this figure can be found by the formula (2):
![]() .
.
Let's find each term separately:
 .
.
 .
.
Finally we find the area:
![]() .
.
Example 8 Find the area of the figure enclosed between the parabola and the curve.

Solution. Let's express the equations of the lines in terms of Y:
The area according to the formula (2) will be obtained as
![]() ,
,
Where a And b- abscissas of points A And B. We find them by solving the equations together:

Finally we find the area:

And, finally, there are cases when the area of a figure can be calculated using formula (3).
Example 9 Find the area of the figure enclosed between the parabolas ![]() And .
And .